


— It’s Bigger Than You Think And It’s All About The Wasted Votes
There is a lot of talk about a Republican Electoral College advantage — that the Republicans can win an Electoral College majority even though they get fewer popular votes.
It is true, and the Republican advantage is bigger than many people realize. In 2020, Joe Biden had a 4.54% margin in the two-party popular vote, yet a change of just 51,399 perfectly allocated votes in Arizona, Georgia, and Pennsylvania would have given the election to Donald Trump. Biden’s popular vote margin would have only slipped to 4.5% of the vote, but he would have lost in the Electoral College.
So, what is the cause of this huge Republican advantage? One often hears that the Republicans have an advantage because smaller states — which have more electoral votes per voter because of the extra 2 electoral votes each state gets irrespective of population — tilt Republican.
This was not true in 2020 and is unlikely to be true this time.
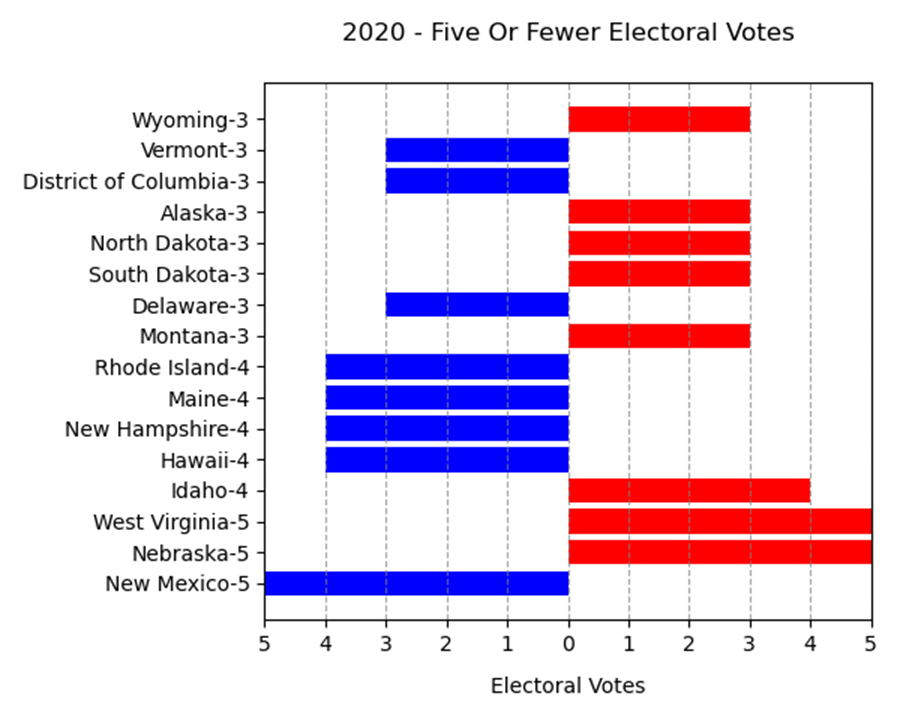
The net effect is that the Democrats picked up one net electoral vote from the small states.
A little more analysis shows that it is all about the wasted votes.
What are “wasted votes”? In all states except Maine and Nebraska, each state assigns all its electoral votes to the candidate who gets a plurality of votes in the state. Since minor party candidates won no states, it is only the competition between the Democrats and Republican candidates that matters.
As Maine’s electoral vote split is almost certain to net +1 for the Republicans and Nebraska’s +1 for the Democrats, we can ignore that effect in our analysis.
Since winning the state-wide vote by a single vote gains a state’s whole electoral vote, any votes above a bare plurality are “wasted”; they have no impact on the Electoral College outcome. Wasted votes are the extra votes in a State that don’t impact the electoral vote for that State.
For example, in Maryland in 2020 Presidential vote the Democrats had 1,008,609 wasted votes:
Democratic Vote 1,985,023
Republican Vote 976,414
Wasted Votes 1,008,609
The Democrat’s 1,008,609 wasted votes did not impact which party won Maryland’s ten electoral votes; winning by 1 vote in the popular vote would still have earned the electoral votes.
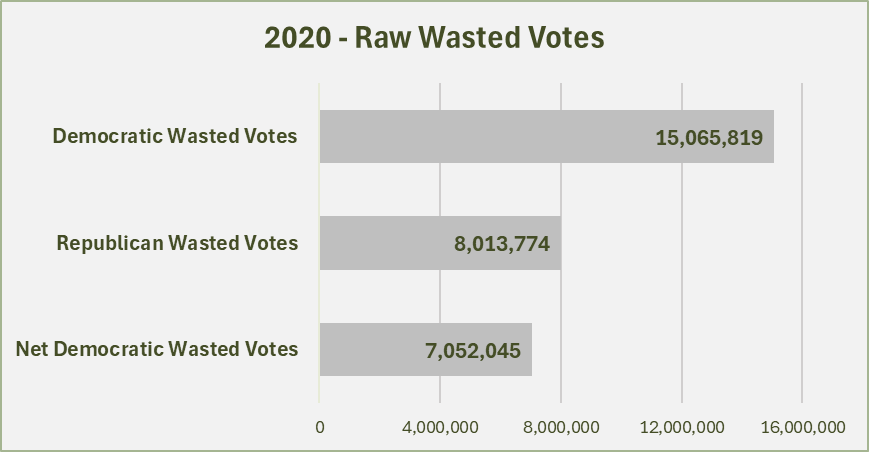
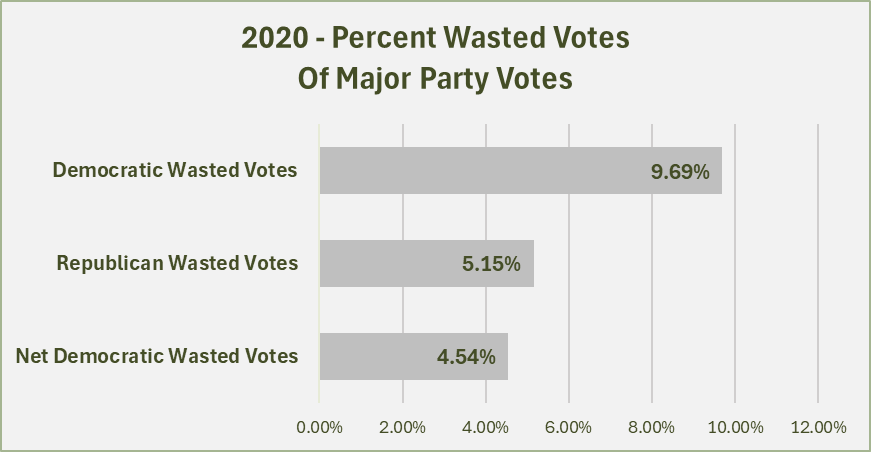
In 2020 the Democrats had many more wasted votes in 2020 than did the Republicans:
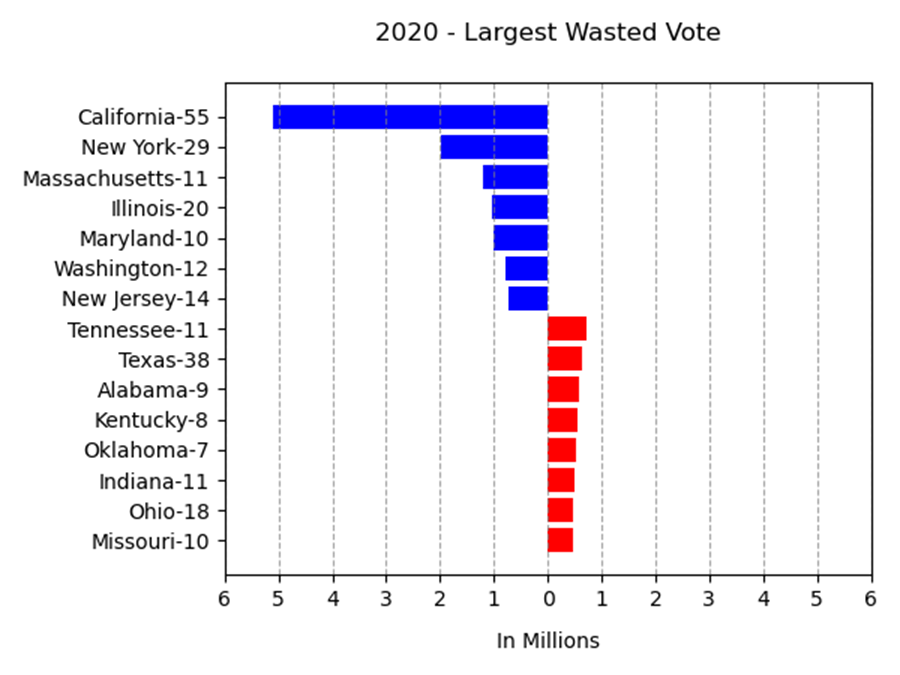
So where does this large advantage for the Republicans in wasted votes come from? The major cause is that the States with the largest wasted votes are Democratic, while the wasted votes size is generally smaller for Republican States. That is, Blue states tend to be considerably bluer than Red states are Red.
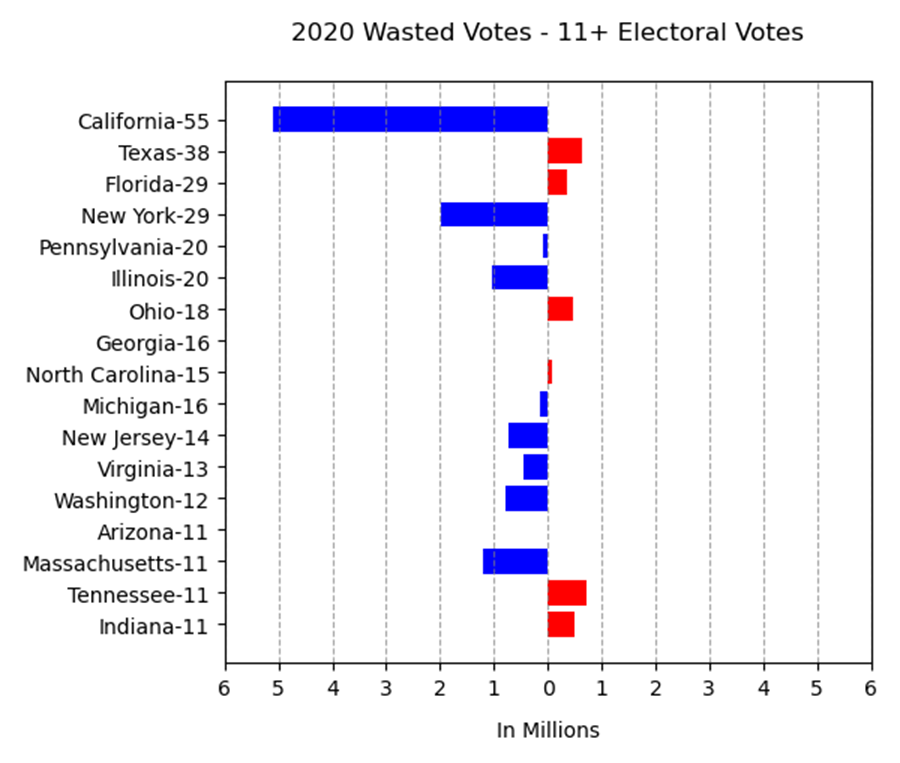
The chart below shows the 15 states with the largest wasted votes ranked by the size of their wasted vote. Electoral votes are next to the state names. You can see that Democratic states are at the top of the list. The top wasted vote Republican states have fewer wasted votes.
Here is another way to look at it: let’s just look at the biggest states. In the figure below, we see that among the biggest states, the big Blue states generally have many more wasted votes than the big Red states do.
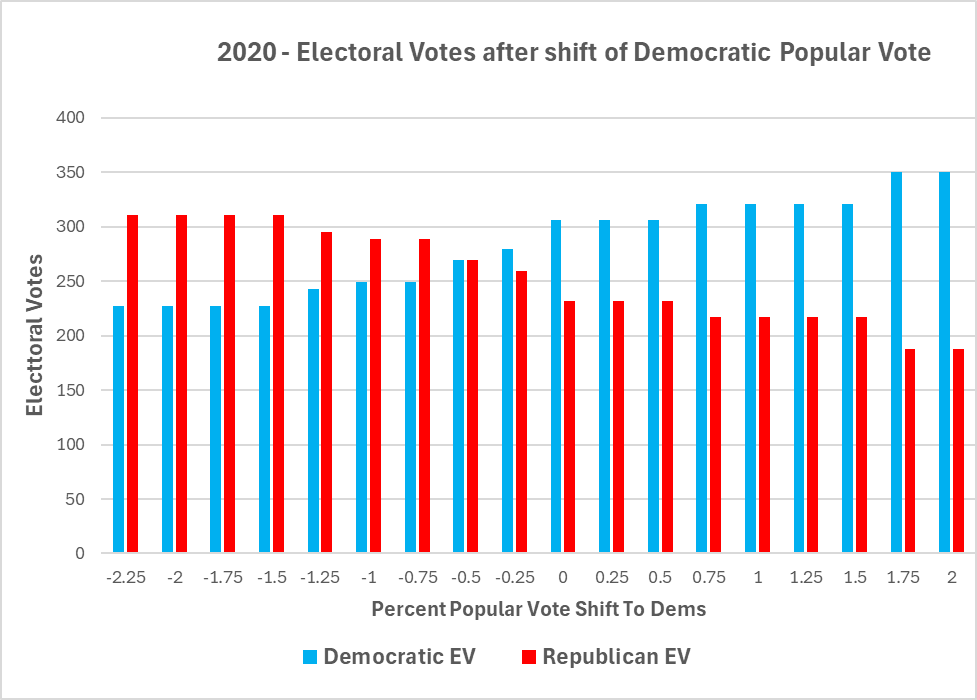
So, how significant is the wasted vote effect? The answer is it’s big. In 2020, the Democrat’s margin in the two major party votes was 4.54%. The figure below shows what the electoral vote count would have been after a shift in the two-party popular vote while keeping the same pattern of wasted votes.
A positive shift means a gain in the popular vote margin for the Democrats by the shift amount. A negative shift means the opposite. For example, a margin shift of +2 means the Democratic two-party margin is 6.5% rather than the actual 4.5%, while a margin shift of -2 means the Democratic margin is 2.5%. The vertical bars indicate the electoral vote for each margin shift. Blue for Democratic, red for Republican.
As we can see, a negative shift of 0.5% would have led to an approximate electoral vote tie, while a negative shift of -0.75% in the popular vote would have led to a clear Republican victory. At a 0.75% negative shift, the Democrats would have lost in the Electoral College 289(R) to 249(D) while still winning the popular vote by 3.75%.
As to the 2024 Presidential election, current state-level polling shows that we should expect a similar pattern of wasted votes as in 2020. California, New York, Illinois, and Massachusetts will again be very blue, while Texas, Florida, and Ohio will be closer as they were in 2020.
If the Republicans attract an increase in minority voters, as some polling indicates, there may be a modest tightening in the big Blue states, but the overall pattern is likely to look similar.
Below is a figure showing the vote shift graph adjusted to reduce the 2020 Democratic wasted votes by 20%. The new result, after the reduction in wasted votes is that the popular vote margin needed for the Democrats to win decreases from 2020’s 4.0% for a tie and 4.25% for a pretty clear Democratic victory to 3.5% Democratic popular vote margin for a near tie to 3.75% for a likely victory for the Democrats.
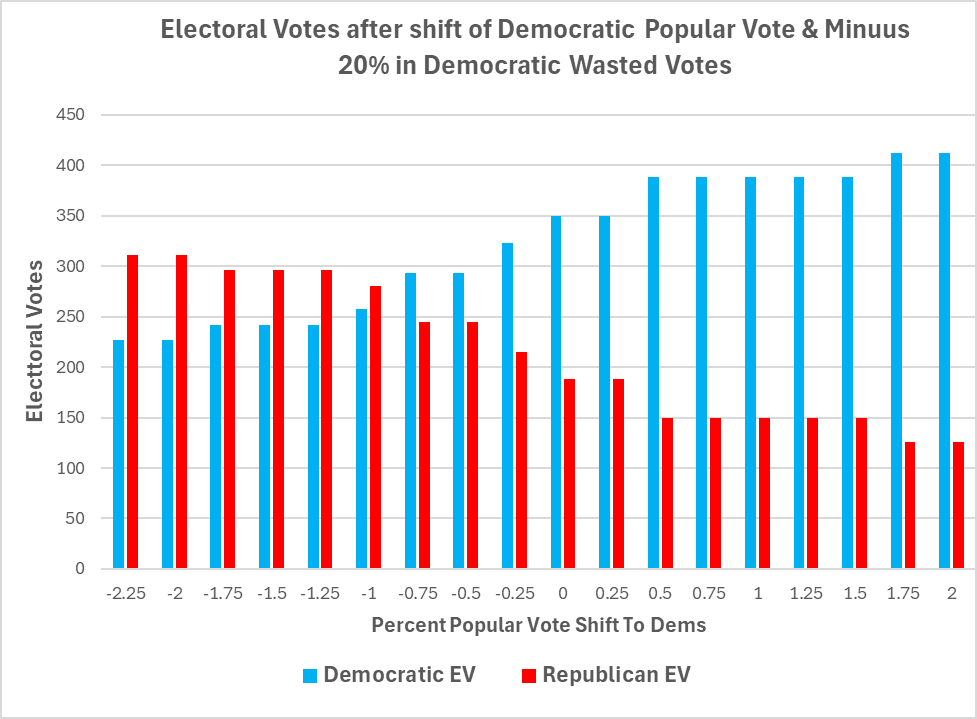
This is a larger spread than many analysts, including Nate Silver, suggest.
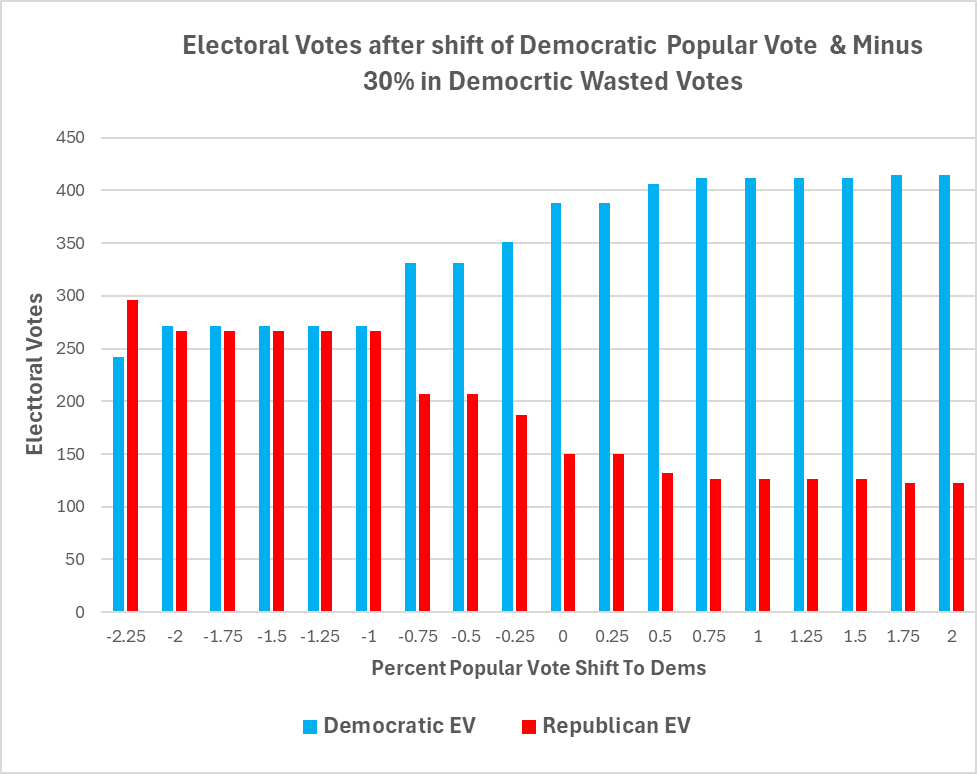
Let’s imagine an even more optimistic scenario for the Democrats — that they reduce their wasted votes by 30%. That seems optimistic. Hard to see big Democratic majorities evaporating in California, New York, Massachusetts, Illinois, Maryland, Washington, and New Jersey, nor big red states like Texas, Ohio, or Florida becoming much more red. But if somehow there was sufficient change in patterns to reduce Democratic wasted votes by 30%, the Democrats still need a 3.75% margin to have a high probability of winning while a 2.25% Democratic popular vote margin is a likely Republican win. From 2.50% to 3.50% Democratic margin, it looks like a dead heat.
With today’s (October 28th) RealClearPolitcs poll average showing a 0.1% Trump lead in the popular vote, it appears that after considering the wasted vote effect, Harris very optimistically (30% reduction in Democratic wasted votes) needs a 2.5% popular vote margin to be in contention, and a 3.75% for a high probability of a win. While barely within the error ranges of the national polls that indicates a tough race for Harris.
With the perhaps more reasonable 20% reduction in Democratic wasted votes, she still needs 3.75% popular vote margin to win with rapidly falling probability below that.
It’s important to note that the current Republican wasted vote advantage is not a built-in feature of the system. As recently as 2004, the Democrats had a wasted vote advantage. The Republicans ran up huge margins in the South, Rocky Mountains, and Great Plains states, while many of the big states were closer. In 2004, George W. Bush won the popular vote by over 3 million votes but would have lost to John Kerry, if 118,601 votes in Ohio had switched from Bush to Kerry.
Data from The American Presidency Project at UC Santa Barbara
https://www.presidency.ucsb.edu/statistics/elections/2020 augmented with other sources.
Analysis by me.
Tagged with :